So what's a Graph Database?
Relational Databases such as postgres & mySql, arrange data in a tabular manor (think Microsoft Excel) using rows and columns to organize an applications’ information.
NoSQL Databases can use programming languages like JSON to model data in non-tabular means, giving way to enhanced analytic & data application capabilities.
Graph Databases put simply, are a platform with which database architects can arrange their data the way they would on a whiteboard, both visually and interconnected.
Industry use cases for graph databases include social networks, recommendation engines, cyber security, geospatial analysis; any application that uses highly connected data.
Stage 1: Domain Research & Modelling
Prior to working on Graph, the design team had little experience with databases, much less extended cloud based data services, so the 2 months before design kick-off were a bootcamp style sprint to familiarize the team with the structure of a cloud foundry, how database services integrate into an app's stack, and the cloud data service landscape.
Through stakeholder and subject matter expert interviews, plenty of reading, “spinning it up and playing with it", and more reading, we established a grasp on the cloud data industry, competitors, relevant technology, and began to draft an attack plan for the service. One useful artifact we created was a GANT chart style overview of the inter-
connected and overlaying responsibilities of team members within the extended platform. When designing at enterprise scale, its easy to silo the design team away from back end development and infrastructure; the graph team prioritized an understanding of the ecosystem so we could advocate for design thinking strategies throughout the process.
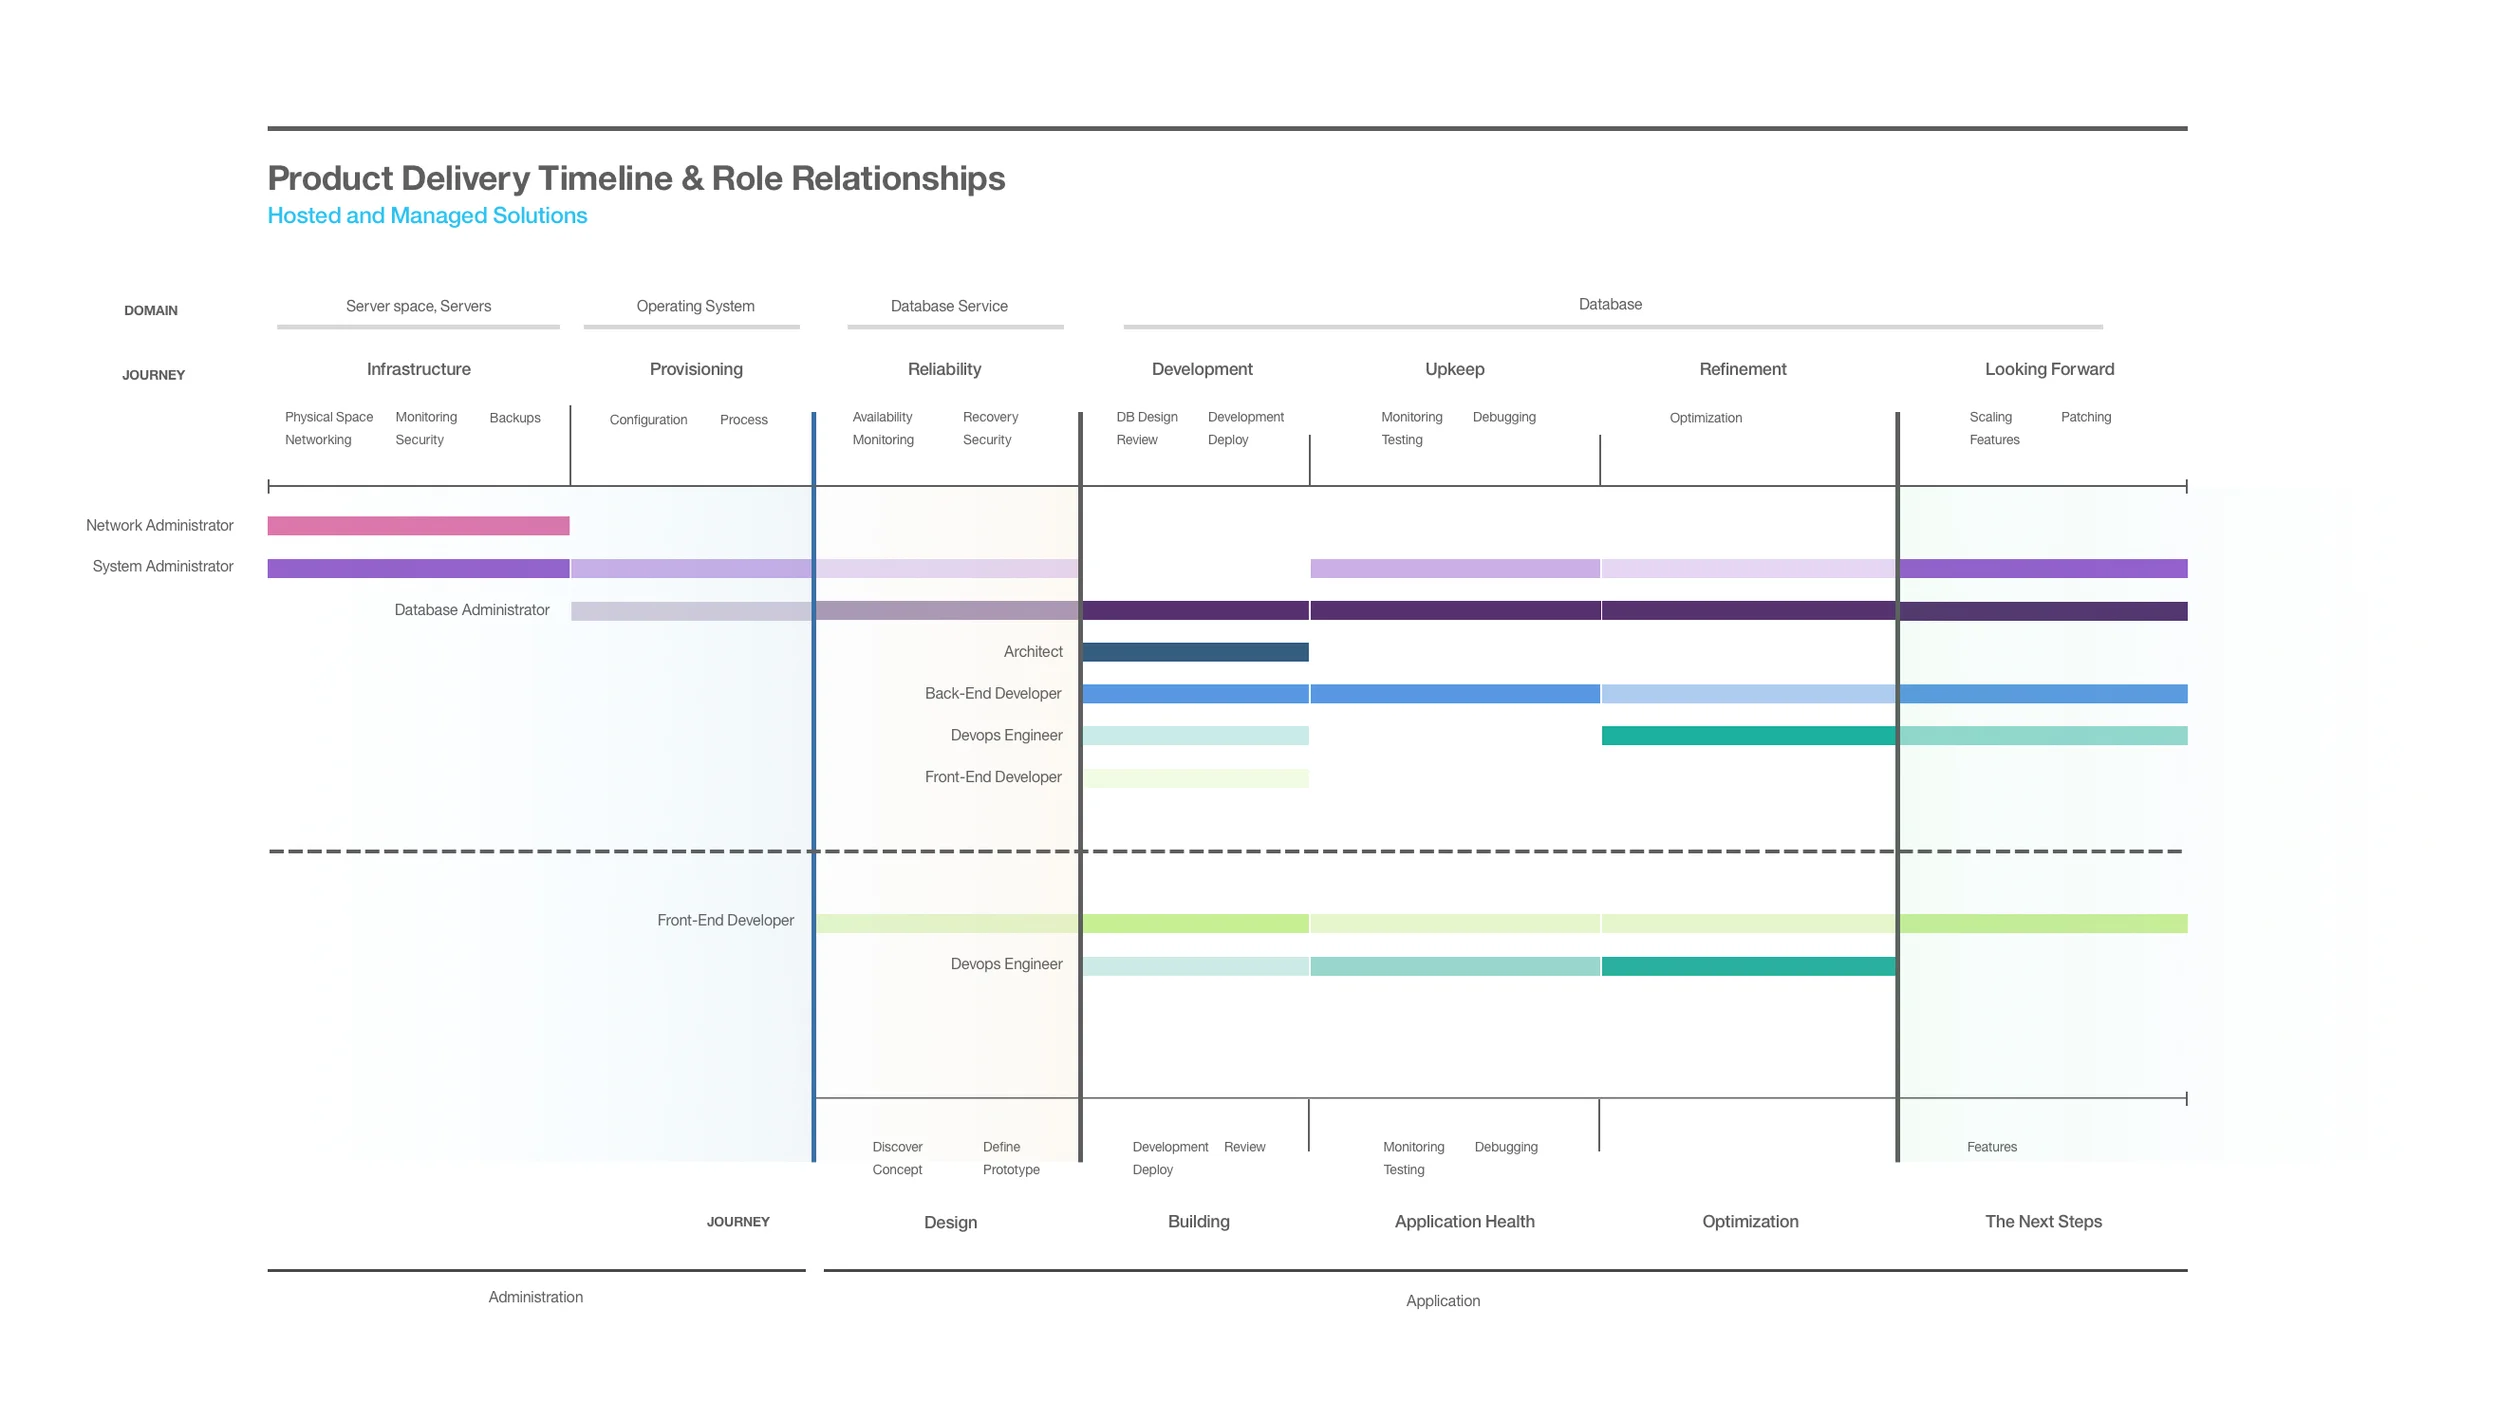
Product Development Timeline
Although slightly outdated, this graphic outlines the general UX design timeline used in the development of IBM Graph, the project was delayed a month for factoring after a decision
to move from a Titan based service to Cassandra.

Stage 2: User Research & Persona Development
We established a research plan, and conducted an initial survey and interviews with internal front end developers, as well as a network of developers outside of IBM that gave us an initial idea of who our target user was, what kind of apps they were building, what tools they already used, etc. A large challenge was finding app dev’s that had already used a graphDB and had
some opinions on how they worked, what visualization and analytic tools they wanted associated, and what they would like to see from a next generation of graph services. Graph is a fairly new technology to be widely available, and is usually used as an analytics layer on top of a production grade SQL system, instead of a widely adopted core piece of infrastructure.
After aggregating a research base of metrics & insights on target users, we created personas for entry level graph users as well as graph experienced users and data scientists, and shared everything with the extended development, management, and sales teams. Insights were derived and helped inform the initial concept for the UI as well as some service decisions.
Research Murally
Throughout our research process, we needed a way to aggregate large amounts of competitive landscape information and interview fragments, so we decided to create a collaborative research Murally board with which we could combine 2 months of research into one hub.
—
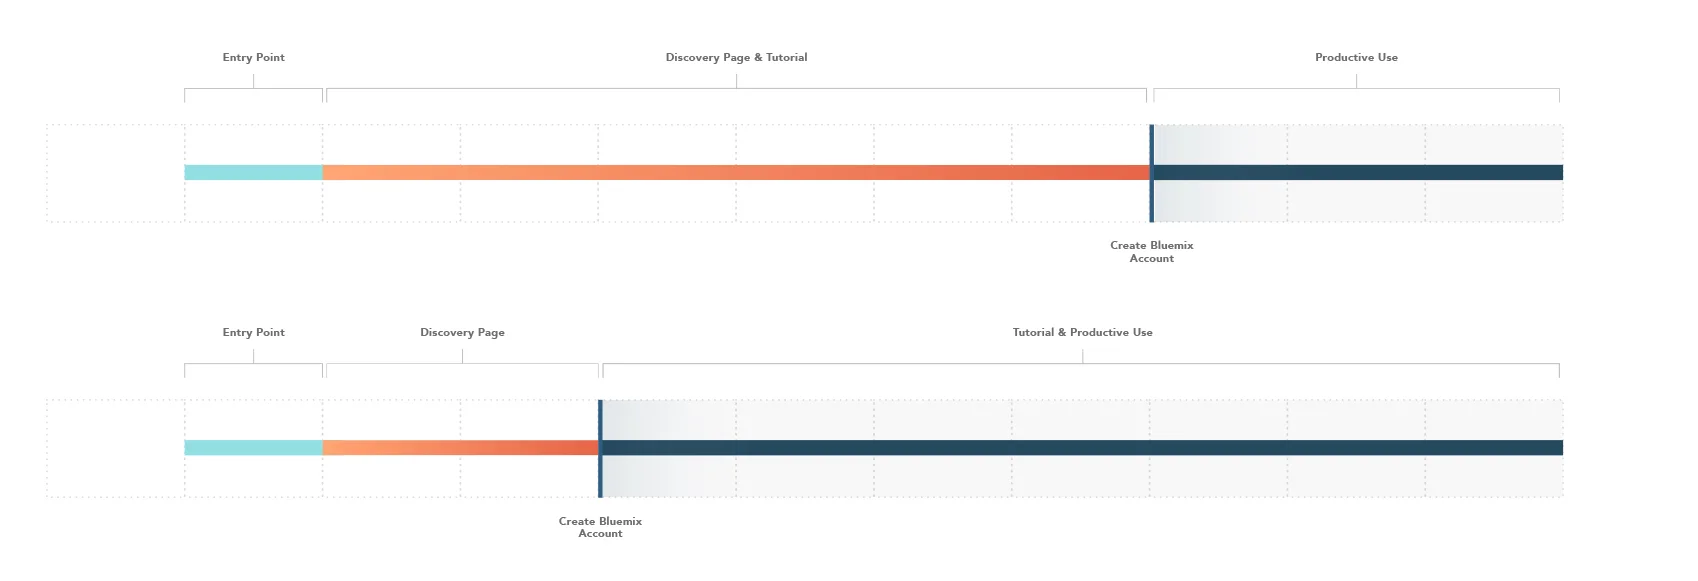
User journey maps
Taking a page from the service design handbook, we created this hybrid artifact to describe a users entire journey and product experience by encompassing everything that happens before and after the actual service instance.
These became widely popular with the graph team, and eventually the IBM Design Studio picked them up as a standard artifact in the UX practice. Woohoo!
—
Challenge: Bluemix Platform design restraints
If you haven’t heard, most IBM cloud services exist inside of a foundry called Bluemix. This poses an interesting challenge to product teams, because there are certain UX paradigms & performance capabilities pre-decided for services on the platform. Bluemix also has a poor adoption and retention rate due to it being early in the stages of a PaaS environment.
So how do you build a great service inside of a (not so great) foundry? You try to push as much of the experience as you can into pre-platform, and once you demonstrate service value, you have a much better chance of user adoption of that platform. This is one of the major challenges our team faced in the design process.